Cards Detail
Unlike paper report, instant-Billings report can be interacted with. Here are the sample actions.
Tooltips
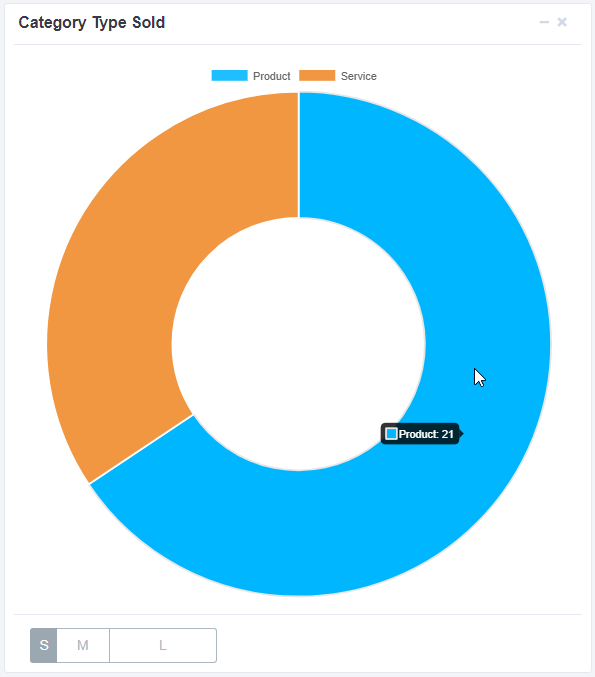
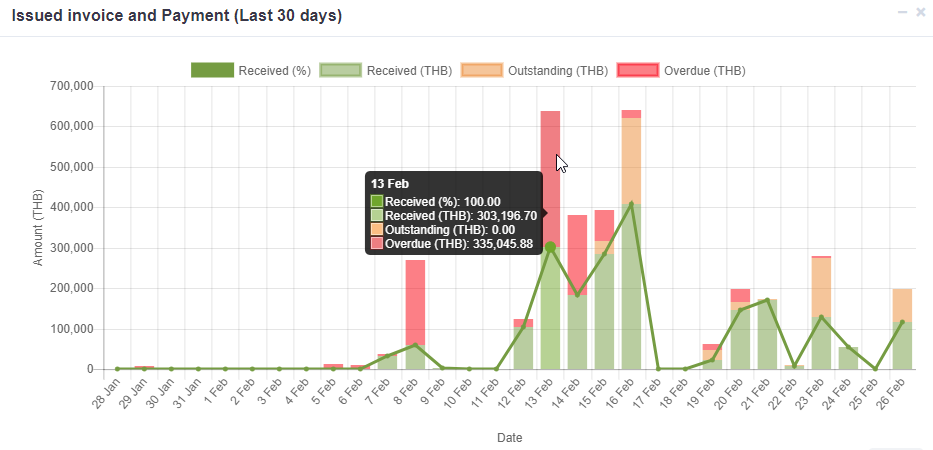
Hover mouse to see detail of chart labels and values.
 Legend
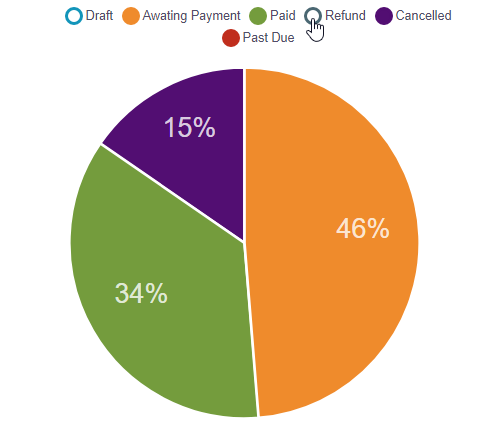
Click on legend to hide corresponding data, click again to show.
Button
Click on button, to switch to a corresponding chart.

Chart explanation
1. Outstanding vs. Received
This mix chart has two type of graph display together. A stacked bar chart where the green color is refer to "Received", the orange color refer to "Outstanding"and the red color refer to "Overdue". Received is amount of money customer paid while Outstanding is amount of money customer still not paid or awaiting to pay. Together, a bar show how much billings in that day. While Overdue is amount of money invoice was issued but does not receive because the customer did not pay before invoice has expired. Another chart is a line chart, which is help illustrate the trending of received in percentage scales. The X axis shows invoice date of last 30 days while the Y axis shows Amount in Thai Baht.
2. Summary
Summary shows all times information of Total invoices, Total items, Total Customer, and Sales Growth of Today v.s. Yesterday.

3. Invoice Summary
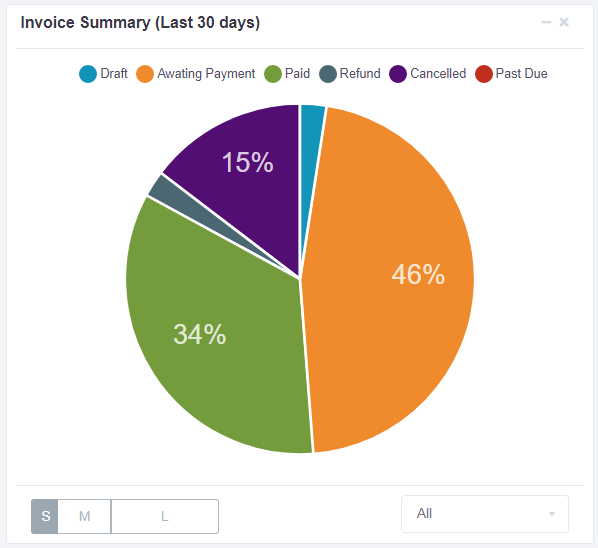
Invoice summary show last 30 days invoice status
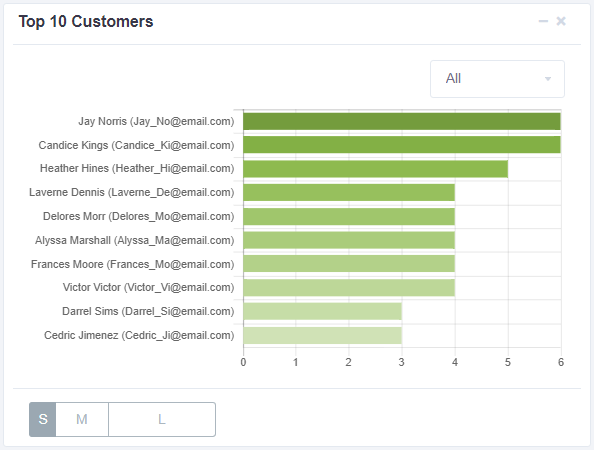
4. Top 10 Customer
Top 10 Customer shows the first ten customers name and email rank from the highest number of total billings paid to the lowest.
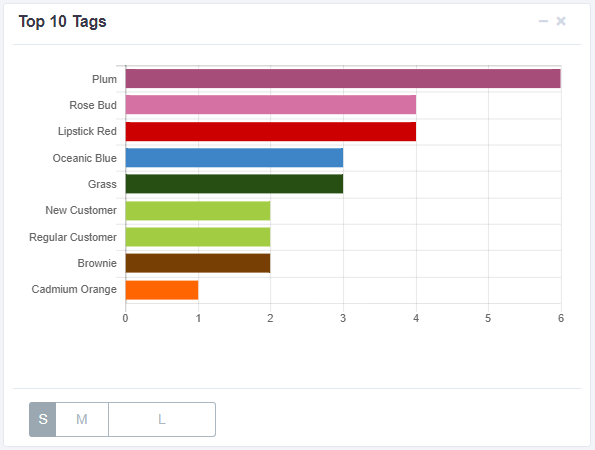
5. Top 10 Tags
Top 10 Tags shows the rank of most phrase use for tagged customers. This chart will not include tags that do not listed in merchant settings, the one-time use grey tag or deleted tag for instances.
6. Top 10 items
Top 10 items shows the first ten items that have the highest number of billings.

7. Top 10 Categories
Top 10 Categories shows the first ten item categories that have the highest number of billings.

8. Category Type Sold
Category Type Sold shows amount of item sold of two types; product v.s. service.
